Welcome to Budgets and Bytes, our new series where we look at what is going on in the world of digitalisation and its relevance for public finance. This month we are covering a new digital government index from the World Bank. We flagged the publication of the World Bank’s GovTech launch report and short-term action plan back in February. The bank has now followed this up with the release of its GovTech Maturity Index (GTMI) which aims to measure ‘the state of public sector digital transformation’.
Why do we need another digital government index?
Although several digital government indices already exist (see Table 1), the report contends that none of these comprehensively cover the four GovTech focus areas – core government systems, public service delivery, citizen engagement and GovTech enablers. This could lead countries to miss opportunities to develop robust GovTech solutions by failing to holistically consider ‘systems, strategies, interoperability, and other aspects that are not covered in the existing global datasets’.
| Digital government surveys and indices | Number of economies | Launched | Last update |
|---|---|---|---|
| World Bank Group (WBG) GovTech Maturity Index (new) | 198 | 2020 | 2020 |
| United Nations e-Government Development Index (EGDI) | 193 | 2003 | 2020 |
| Global Innovation Index (GII) | 131 | 2007 | 2020 |
| European Union e-Government Benchmark | 36 | 2012 | 2020 |
| WBG Identification for Development (ID4D) Index | 198 | 2015 | 2018 |
| WBG Digital Adoption Index (DAI) | 180 | 2016 | 2018 |
| CAF GovTech Index (new) | 16 | 2020 | 2020 |
| OECD Digital Government Index (new) | 33 | 2020 | 2020 |
What does it measure and how does it measure it?
The GTMI has 48 indicators across four sub-indices, corresponding to the four focus areas (see Table 2). Each indicator has a point score and a weighting. These are summed and then normalised on a scale from 0 to 1 for each of the four sub-indices. The overall GTMI is the simple average of the four sub-indices.
| Index | Indicators | Points | Weights | Max score |
|---|---|---|---|---|
| Core Government Systems Index (CGSI) | 15 | 41 | 35 | 85/85 |
| Public Service Delivery Index (PSDI) | 6 | 14 | 12 | 21/21 |
| Citizen Engagement Index (CEI) | 12 | 13 | 22 | 24/24 |
| GovTech Enablers Index (GTEI) | 15 | 27 | 38 | 61/61 |
Many of the indicators are binary. For example, the first indicator in the GovTech Enablers Index (indicator 34) asks ‘is there a government body focused on GovTech / digital transformation?’. Countries which have such an institution score a 1, while countries that do not score a 0.
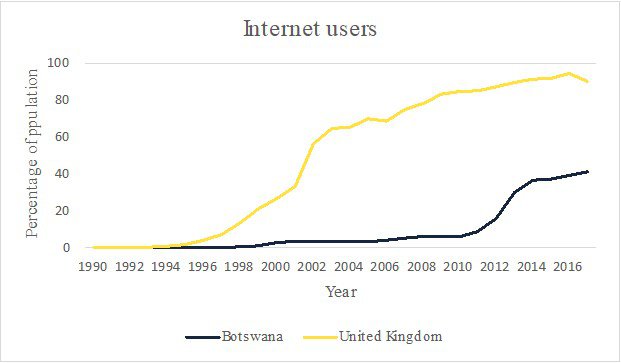
Most of the indicators are measured on an ordinal scale. For example, indicator 17 asks ‘is there an online public service portal for citizens, businesses, and government entities?’, and is scored from 0 to 2. Countries without one score a 0, those with one that provides information and forms score a 1, and those with one that provides transactional functionality score a 2. An example of a public service portal that scores a 2 is the United Kingdom’s GOV.UK which allows a user to access benefits online, in contrast to Botswana’s GOV.BW which provides information on benefits and how to access them offline, and therefore scores a 1. Of course, this is a solution that probably better fits the current context of Botswana where just 41% of the population are internet users compared to 93% in the UK (see Figure 1).
Figure 1: Internet users as a percentage of the population
Weightings are based on expert opinions with ‘greater emphasis on more recent GovTech activities which are essential to digital transformation’. There are 12 indicators covering ‘less-known’ areas which have relatively higher weightings. For example, in the Core Government Services Index (CGSI), 5 of the 15 indicators account for more than half of the score (see Table 3 below). While people may disagree about the weightings, I for one am glad to see the authors of the report acknowledging that some things may be more important than others, something that is often absent in other government indices.
| Indicator | Sub-index | Percentage of sub-index |
|---|---|---|
| I-1 Is there a government cloud available for all government entities? | Core Government Systems Index (CGSI) | 9% |
| I-2 Is there a government enterprise architecture? | CGSI | 14% |
| I-3 Is there a government service bus or interoperability platform in place? | CGSI | 14% |
| I-13 Is there a government open source software policy/action plan for the public sector? | CGSI | 5% |
| I-15 Does the government have a specific national strategy for new/disruptive technologies? | CGSI | 9% |
| I-17 Is there an online public service portal for citizens, businesses, and government entities? | Public Service Delivery Index (PSDI) | 19% |
| I-25 Are there national platforms that allow citizens to participate in policy decision-making? | Citizen Engagement Index (CEI) | 15% |
| I-34 Is there a government body focused on GovTech / digital transformation? | GovTech Enablers Index (GTEI) | 7% |
| I-36 Is there a specific national GovTech / digital transformation strategy? | GTEI | 10% |
| I-37 Is there a whole-of-government approach to implement data governance? | GTEI | 13% |
| I-47 Is there a program to improve digital skills/data literacy and innovation in the public sector? | GTEI | 7% |
| I-48 Is there a government entity/strategy focused on public sector innovation? | GTEI | 13% |
Who scores the best?
The report does not include rankings but rather benchmarks. A for ‘GovTech leaders’ who score above 0.75, B for the countries with a ‘significant focus on GovTech’ who score between 0.5 and 0.75, C for the countries that score between 0.25 and 0.5 and have ‘some focus on GovTech’, and D for those below 0.25 with ‘minimal focus on GovTech’. Moreover, the authors state that the ‘GTMI is not intended to create a ranking of countries’ but rather is ‘expected to assist practitioners in benchmarking countries to highlight gaps in terms of how far those countries are from the leaders at a specific time’. I hope that governments follow this guidance, but there are perverse incentives to think about these scores in a different way from a government official’s perspectives.
Unsurprisingly the GTMI is correlated with income (see Figure 2). Most of the ‘leaders’ are Organisation for Economic Co-operation and Development (OECD) countries. As a lower-middle-income country, India is a notable outlier within the ‘leaders’ group. Though it’s no shock to find it here given the country’s digital transformation initiatives over the last decade.
Figure 2: GovTech maturity is correlated with income levels
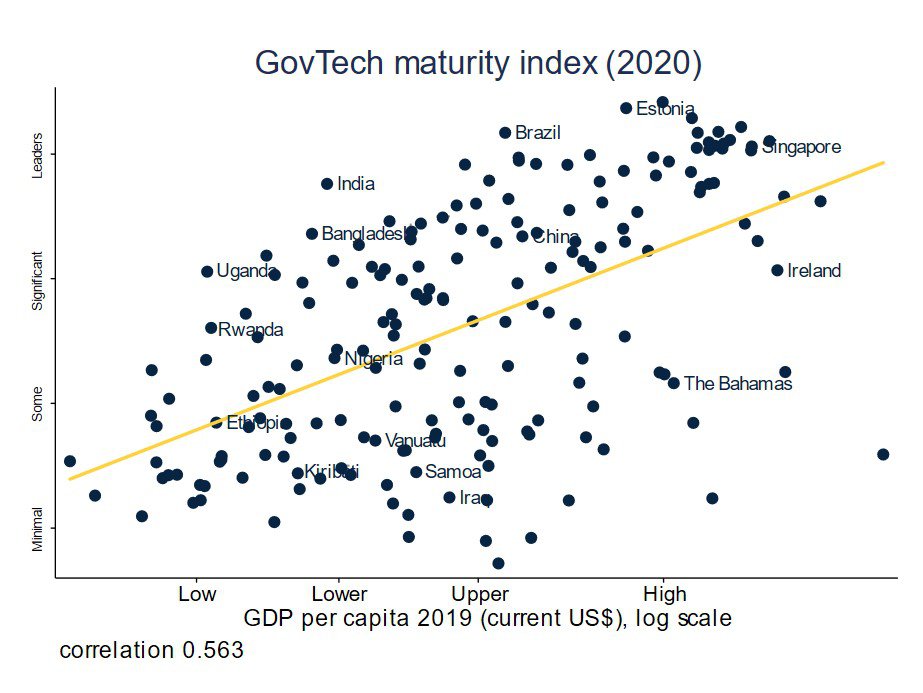
There are also a group of nine upper-middle-income countries (Argentina, Brazil, Colombia, Malaysia, Mexico, Peru, South Africa, Thailand and Turkey) amongst the ‘leaders’. It is perhaps surprising not to find China amongst this group, although it’s not too far behind.
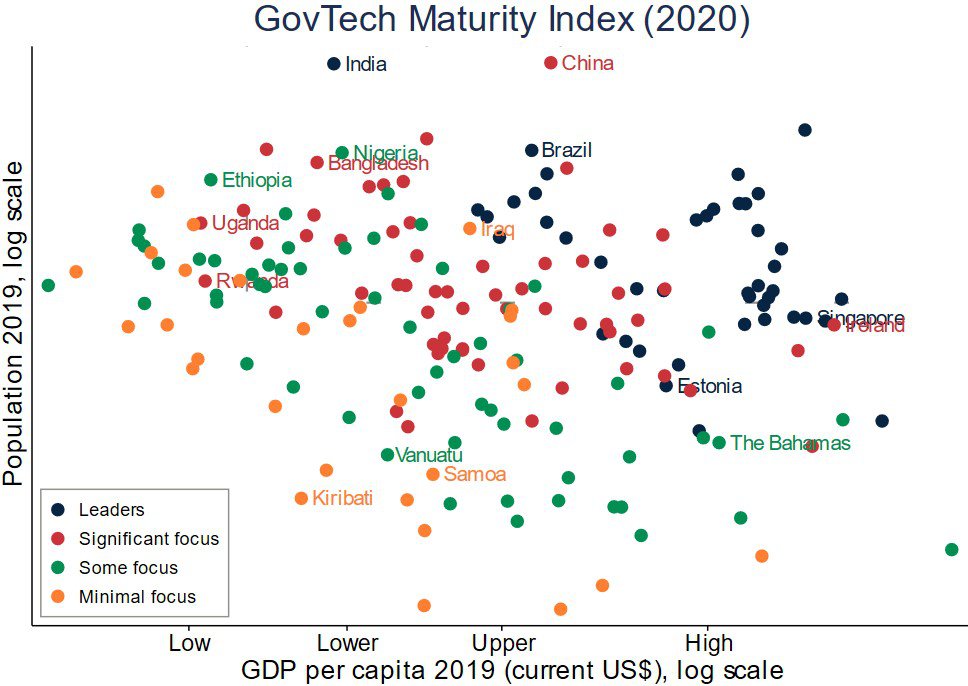
More generally, there is a lot of variation in performance on the GTMI across income groups. The size of the country seems to be an important factor, with populous federal states performing better on average, while smaller countries tend to perform worse on average (see Figure 3).
Figure 3: Across income levels more populous countries perform better on the GTMI
My hunch is that there are two underlying reasons for this.
- Economies of scale – for these big economies, the costs of public sector digital transformation are not as significant a proportion of available resources as they are for smaller economies (i.e. India may have an income level and a tax-to- gross domestic product (GDP) ratio similar to that of Vanuatu and Kiribati, but its economy is 3,000 times the size of the former and 15,000 times the size of the latter). Similarly, countries with bigger populations will have a larger pool of talent (e.g. computer science graduates) from which to draw on, whereas smaller country governments will find themselves in competition with the private sector for this scarce resource.
- Centralisation of information – most countries want to centralise the flow of information on inputs, outputs and outcomes to understand whether national policies are being followed and producing results. This is a difficult enough task in any context, but even more so in large federal countries. So digital transformation may be more of an imperative in these environments. Smaller countries may simply be able to pick up the phone and find out what they want to know.
Of course, the performance of countries like Estonia and Singapore shows it’s possible for smaller countries to also lead the way in public sector digital transformation. In addition, it may be a cause for concern that big economies like Ethiopia and Nigeria are not performing as well as their peers in Uganda, Rwanda and Bangladesh on the GTMI.
What is the relevance to PFM?
By my count, 13 of the GTMI’s 48 indicators are questions that have direct relevance to public financial management (PFM) (see Table 3). These are concentrated in the Core Government Services Index (CGSI) and the Public Services Delivery Index (PSDI).
| Indicator | Sub-index | Points | Weight |
|---|---|---|---|
| I-4 Is there an operational financial management information system (FMIS) to support central government PFM functions? | Core Government Services Index (CGSI) | 0–3 | 1 |
| I-5 Is there a treasury single account (TSA) linked with FMIS to automate payments and bank reconciliation? | CGSI | 0–3 | 1 |
| I-6 Is there an operational tax management system? | CGSI | 0–3 | 1 |
| I-7 Is there an operational customs system? | CGSI | 0–3 | 1 |
| I-8 Is there a human resources management information system (HRMIS) with an online service portal? | CGSI | 0–3 | 1 |
| I-9 Is there an operational payroll system linked with HRMIS? | CGSI | 0–3 | 1 |
| I-10 Is there an e-procurement portal supporting public procurement? | CGSI | 0–3 | 2 |
| I-11 Is there an operational debt management system (foreign and domestic debt)? | CGSI | 0–3 | 1 |
| I-12 Is there an operational public investment management system? | CGSI | 0–3 | 2 |
| I-18 Is there an operational tax system online service portal? | Public Services Delivery Index (PSDI) | 0–3 | 1 |
| I-19 Is there an operational e-filing service portal for citizens and businesses? | PSDI | 0–3 | 1 |
| I-20 Is there an online e-payment portal providing support for various e-services? | PSDI | 0–2 | 1 |
| I-21 Is there an operational customs system online service portal? | PSDI | 0–3 | 1 |
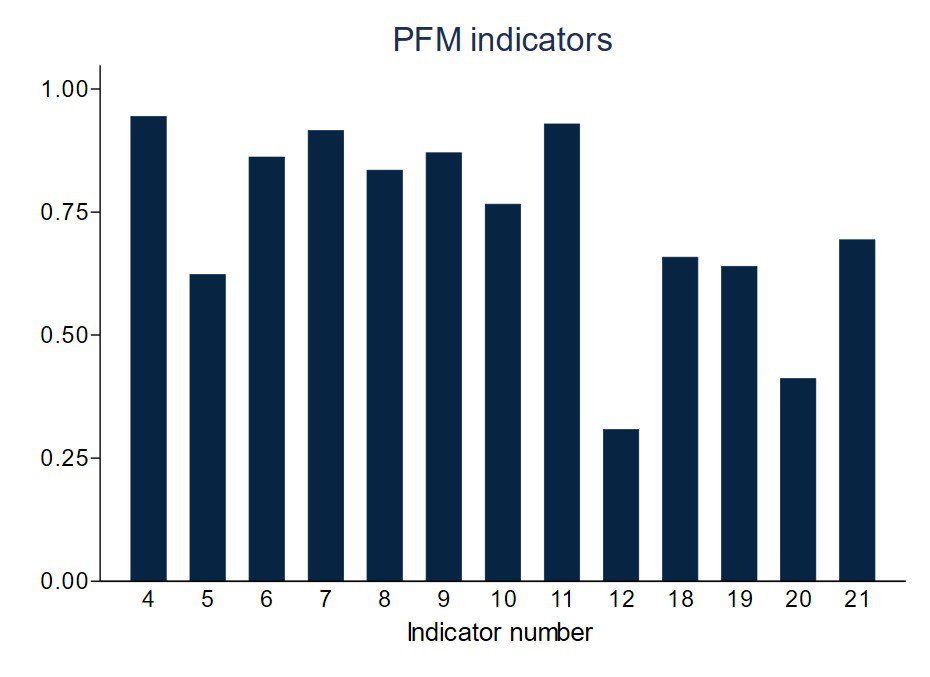
These PFM indicators carry relatively lower weightings. This presumably reflects the fact that many of these systems have been around for decades, and most countries already score well on these indicators (see Figure 4). Exceptions are I-12, where public investment management systems are not as common as other PFM systems, and I-20, which relates to the relatively new innovation (in government at least) of e-payment platforms.
Figure 4: Average performance on PFM indicators
This does not mean that PFM is digitally mature in most countries. As the report points out ‘most of these systems are not interconnected and data exchange is not sufficiently automated using web services/APIs’ and so ‘future GovTech initiatives are expected to focus on improving the interconnectivity and interoperability of existing systems and portals, benefiting from government service bus and government cloud as shared platforms’.
What is to be gained from this ability to exchange data more easily between different government systems?
Clearly it would help to enable more efficient PFM. From budget preparation through to budget evaluation there are often delays arising from matching, reconciling or checking data between different government systems. Improving the timelines and accuracy of these processes could lead to improvements in various PFM processes. For example, countries including Estonia and Portugal have been able to link their e-procurement systems to other government systems to carry out background checks on suppliers. While important, this interoperability changes how governments do things, not what they do.
The bigger prize of PFM and digitalisation may be the potential to allow governments to change what they do. For example, recently we have seen Togo introduce social security payments using digital technologies including satellite imagery, machine learning and mobile payments, by integrating data from geographic information systems (GiS), household surveys and phone data. In the UK, Her Majesty’s Revenue and Customs (HMRC) has been able to repurpose its ‘platform’ to support the government’s Covid-19 policy responses from the ‘furlough’ scheme to the ‘Eat Out to Help Out’ scheme.
What is missing from the index?
Another reason we should not be overly excited about the digital maturity of PFM is that, as the authors point out, the GTMI ‘mostly reflects de jure practices’ rather than ‘information about the implementation status and outcomes of GovTech activities’. And we have seen for example how having a financial management information system (FMIS) is a far cry from using it effectively. As such the GTMI it is more a measure of form than function.
Other gaps and omissions in the index include:
- A central government focus – this is due to ‘the limited availability of data at the subnational level’. Hopefully this is something that may improve in future updates as well, given the opportunities for subnational governments, particularly in the area of property tax which was the subject of a recent International Centre for Tax and Development (ICTD) webinar.
- Lack of sectoral coverage – the report notes that ‘the data on other MIS solutions used in health, education, social protection, transport, agriculture, land management, trade, and other sectors are limited’. Those of us with an interest in PFM and service delivery will be hoping this is also something the bank can remedy in future iterations. Integrating sectoral management information systems (MIS) with PFM systems may be more important for service delivery than integrating PFM systems with each other.
- Registries – given their foundational importance for digital transformation, the lack of an indicator for the maintenance of registries seems like an important omission. Though in fairness, indicator 35 (‘Is there a government entity in charge of data governance or data management?’) does get at the issue.
The GTMI is nevertheless a welcome improvement in our understanding of what is happening on public sector digital transformation around the world, and the underlying Digital Government/GovTech Systems and Services (DGSS) Dataset contains reams of useful information beyond what actually appears in the index including how long different systems have been in place, and whether they were purchased or developed in-house. Moreover, the next update of the database (in two years’ time) ‘may be based on surveys and interactions with country officials’ to capture de facto practices and outcomes.
